Object-Oriented Design and the Fetish of Reusability


1371806059-0

Sculpture by Finn Stone

Software Development Best Practices in 2016.

One of the touchstone differentiators of Axial Engineering is to constantly recognize that “Engineer is a subclass of HumanBeing”. As such, we are prone to act with implicit biases which might affect our effectiveness. Since another one of our principles is to maximize the impact of our work, we strive to constantly challenge our assumptions, especially about how our course of action relates to our highest goals as a company, as professionals and as Human Beings. One area that is ripe for re-assessment is the set of accepted ‘Best Practices’ in Software Development, and how they relate to our goals. In that spirit, we’ll be touching over this series of posts on several of the dogmas of our craft, and thinking through their applicability to our situation and point in time.

Part I: Object-Oriented Design and the Fetish of Reusability

Over the last couple of decades, Object-Oriented Design achieved the status of dogma in terms of what constitutes good quality in software development. That’s how “Object-Oriented” and “good” became almost synonymous in our craft. There is also, on the surface, plenty of agreement on what constitutes “Object Orientation” in software design. Almost every interviewee is able these days to recite the expected mantra: “Encapsulation, Inheritance, Polymorphism and Function Overloading”. …”You know, like Java, or Ruby or C++”.

We should all be concerned about unexamined assumptions, and there are a couple of huge ones in the common views of OOD, which in my opinion affect our whole industry considerably. The first one is on the definition of what constitutes good Object-Oriented Design and its relationship with these “Four Noble Truths” mentioned above, which we’ll touch upon in a future post. The second one is more implicit, hidden and perhaps more pernicious: It pertains to the reason on why we want Object Orientation in our software. Let’s start there, for there would be no profitable reason to invest time reasoning about the essence of a technique, if we can’t identify the benefits of using it.

It might sound strange to even ask what’s the benefit of Object-Oriented Design. Ask almost anyone and the same answer will be forthcoming: Reusability, of course! … Finally moving software construction into the Industrial Age, where we can buy or download standard parts, just like microchips and build good quality software in record time!… The best I understand it, the common perception of Reusability is to create software components as generic and flexible as possible, so that they can be applicable to the greatest number of unforeseen future uses while remaining unchanged. As the theory goes, if we build our software this way, we’ll be able to never touch these components again, and use them in many thereto unforeseen scenarios.

So far so good, I suppose. Alas, in order to build such extreme level of ‘genericity’ in our software, the complexity and cost of building it goes up almost exponentially. Let’s dwell on that for a moment: Suppose you work for a company that sells some gadgets called ‘Things’. Let’s say you want to build some software, like your “Inventory Manager of Things’where ‘Thing’ is a well-defined concept that everyone in your company understands. But let’s, as a thought experiment, make this software as reusable as possible. To achieve this, typically, we’d start with classes, then we’d make them into class hierarchies using Inheritance, and then we’d abstract the interfaces into protocols, contracts or interfaces, depending on your language of choice. But… wait! Who knows if we’ll need to apply this to some future ‘OtherTypeOfThing’? So, let’s make some ‘AbstractThing and ‘SpecialThing’ and their corresponding ‘IAbstractThing’ and ‘ISpecialThing’ abstract interfaces, while considering every combination of concepts or ideas in which such a hierarchy could be remotely applicable. Done? Not so fast: At that point we might want to throw in our ‘AbstractThingFactory’ and several ‘ConcreteThingFactories’, (after all, we want to throw in some Design Patterns), and while we are at it, we might as well make ‘Thing’ generic, with all the ‘AbstractThing<T>’, ‘Thing<T>’ and even ‘ThingHelper<T>’ paraphernalia that it will ever require. And, -bonus!-, as a software developer, it is likely that you love dealing with abstraction, so most likely you’ll have a blast thinking through this. Life as a reusable software developer feels at this point like it it can’t get any better. Throw in some Inversion-of-Control and Configuration-by-Convention, while controlling all of these options with a nice, juicy (but computationally unaccountable) set of XML or JSON configuration files, and you’ll be seemingly well on your way to the Holy Grail of Reusability.

Dizzy yet? Let’s go back to Earth. Shall we?

The return on every investment is the relationship between the cost or effort put into it and the real benefits it gives you over time. First, on the effort: The more parts something has, the more it is, by definition, complex. And complexity is always costly: It costs more to build it and it costs more to maintain it. In most cases, it also creates barriers of to diagnosing problems efficiently. For a very simple example, think about the added difficulty of debugging software that goes through abstract interfaces and injected components. Finally, the added complexity creates many different points of touch when a change is needed. Think of how you cursed your luck when you had to change an abstract interface that had many different concrete implementations. And I doubt your QA engineer liked you any more after that…You get the picture: Add up the hours of added effort required to keep such software operating well over its (shorter than you think) lifespan, and you’ll get a good idea of the cost incurred.

Let’s think, on the other hand, about the return side. Don’t get me wrong: Abstract Interfaces, Inversion of Control and Generic Containers or Algorithms all have use cases in which they provide many measurable benefits. We’ll even be discussing some interesting ones in a future post.   But more often than not, the kinds of software for which Reusability is at the top of the priority stack are associated with frameworks that are intended from the beginning for an industry as a whole, and created at a great cost in order to save time in implementing concepts that are by definition abstract. They are also used by hundreds of unrelated teams, in unrelated domains. Think STL, or NumPy or the Java Collections framework. However, these are projects that operate in domains that are orthogonal to the problems most developers face day-to-day. This article from 1998 gives us a very interesting rule of thumb: “…You can’t call something reusable unless it’s been reused at least three times on three separate projects by three separate teams.”.

On narrower domains, if we examine the track record of our previous efforts, we’ll come to confront a disquieting reality: Most “reusable” software is actually never reused. And even when we account for the time saved for the cases when we do reuse it, for most domains we’ll come to see that the return-on-investment of building all software components as highly reusable is, by and large, negative. And yet we persist, as an industry, in perpetuating this myth, while ignoring other potential benefits that we can target in our development process.

And so, we arrive to the point where, if Reusability is the main benefit of Object-Oriented Design, from the cost/benefit point-of-view we might as well dispense with it, unless we are creating the next framework-level collections library. Otherwise, we are not likely to enjoy the benefits of the increased complexity. However, it is our contention that Object-Oriented Design does provide some other real, measurable benefits to the quality of software design, and that these benefits can be achieved without the exponential growth in complexity discussed above. But in order to discuss these benefits lucidly, we need to reexamine our notions of what is essential vs accidental in Object-Oriented Design Practices. That will be the subject of our next blog. For more on that, watch this space.


References

  1. SOA and the Reality of Reuse
  2. The Elusive Search for Business Frameworks
  3. Software Reusability: Myth Or Reality?
  4. The Reality of Object Reuse
  5. A Comparison of Software Reuse Support in Object-Oriented Methodologies
  6. Software Reuse:  Principles, Patterns, Prospects


Ionic Creator – From idea, to prototype, to real life app

Edit 02/26: access to the repo for this code here

The Ionic team has been hard at work trying to lower the barrier of entry in the mobile development world.

The Ionic Creator is a simple prototyping tool that helps developers, designers, and project managers to quickly build mobile apps and websites without having to code.

This allows for a quick feedback loop among a team which helps speed up the development process drastically. A project manager might prototype a design and generate real, clean Ionic code to give to a developer. Or, a developer might use Creator to quickly generate UI snippets and rapidly bootstrap new app projects.

Unfortunately, as of now, dynamic data prototyping is not directly supported in the tool and this tutorial aims at highlighting how this can be done.

What is Creator ?

As Matt Kremer puts it in the very first Ionic Creator tutorial video:
“Ionic Creator is a simple drag and drop prototyping tool to create real app with the touch of your mouse.”

Indeed, Ionic Creator is provides a full set of Ionic components that you can simply drag and drop into your project and rapidly prototype a fully working app.

ionic.creator.components

Who is Ionic Creator for?

  • Novice Developers trying to get their hand in hybrid mobile development
  • Designers tweaking around options for product development
  • Experienced Ionic developers looking to bootstrap their projects
  • Freelance developers gathering clients feedback via sharing features

Collaborate, Share and Export your App

Ionic Creator makes it simple to collaborate and share your app in many ways.

You can send a link to the app running in the browser via URL, Email or SMS so a user can run the app from a browser.

Using the Creator App (available on Android & iOS), you can share the app and have it run directly on the device in similar conditions as if it was a stand alone app.

Finally, you can package your app for iOS and/or Android directly through the Ionic Package service.

Introducing Axial Events!

The goal of v1 of the app is to show a list of events and allow the member to indicate which other attendees they want to meet up with so we can send reminders during the event.

We will need:

  • List of Events: title, content, image
  • Event Detail page: list of attendees with a way to indicate interest

Step 1: Project Creation

First we will pick a blank project as we do not need a side menu or a tab layout.

ionic.creator.project.creation

Step 2: Create the list of Events

Then, let’s rename the new page as Events, drag in some List Item w/ Thumbnail and give each of them some details.

ionic.creator.events.list

Step 3: Create Event details page

For each event, we will need to create a detail page which we will name according to the event and add a list of List Item w/ Thumbnail for the attendees:

ionic.creator.event.details

Step 4: link everything together!

Finally, for each item in our events list, let’s adjust the link to their respective
target page:

ionic.creator.linking

Step 5: let’s take it out in the wild!

At this point, we have an app that showcases how the flow will go from screen to screen.

Let’s take it live and plug it to our API. It’s time to export our app.

ionic.creator.export

Once you open the repository in your favorite text editor, everything has been wired up for you.

With a little bit of Angular knowledge, and a dash of CSS, the sky is the limit!

Let’s clean up the code a bit and plug in our API.

Step 6: Cleanup – Views – Events

First let’s clean up the Events List view and make use of repeating element:

<br /><img src="img/6YS77136Q5yo9V7yjI6g_Atlanta-Summit-hero-image.jpg" alt="" />
<h2>Atlanta Summit 2016</h2>
February 9th, 2016

<img src="img/oQ9mqXNQzeoPtXXwzXzZ_san-francisco-summit-hero-image.jpg" alt="" />
<h2>San Francisco Summit 2016</h2>
March 16, 2016

<img src="img/WTUsCmmCQjWl43vRjGOx_dallas-summit-homepage-image.jpg" alt="" />
<h2>Dallas Summit 2016</h2>
April 13, 2016

then becomes:

<br /><img alt="" />
<h2>{{::event.title}}</h2>
{{::event.date}}

Step 6: Cleanup – Views – Event Info

When duplicating the Event Details page, we created three identical page which should really be one template instead. Therefore, atlantaSummit2016.html, dallasSummit2016.html and sanFranciscoSummit2016.html are replaced by one event.html file which ressembles:

<div style="text-align:center;"><img alt="" width="100%" height="auto" /></div>
<h3>Attendees</h3>
<img alt="" />
<h2>{{::attendee.name}}</h2>
{{::attendee.title}}

Step 6: Cleanup – Routes

Since we have removed the duplicated views, we need to clean up the routes.js file a little from this:

$stateProvider
.state('events', {
url: '/events',
templateUrl: 'templates/events.html',
controller: 'eventsCtrl'
})
.state('atlantaSummit2016', {
url: '/events/atlanta',
templateUrl: 'templates/atlantaSummit2016.html',
controller: 'atlantaSummit2016Ctrl'
})
.state('sanFranciscoSummit2016', {
url: '/events/sanfrancisco',
templateUrl: 'templates/sanFranciscoSummit2016.html',
controller: 'sanFranciscoSummit2016Ctrl'
})
.state('dallasSummit2016', {
url: '/events/dallas',
templateUrl: 'templates/dallasSummit2016.html',
controller: 'dallasSummit2016Ctrl'
});

to this:

$stateProvider
.state('events', {
url: '/events',
templateUrl: 'templates/events.html',
controller: 'eventsCtrl'
})
.state('event', {
url: '/events/:id',
templateUrl: 'templates/event.html',
controller: 'eventCtrl'
});

Step 6: Adjust Controllers

Instead of one controller per event, we will need one eventCtrl controller:

angular
.module('app.controllers', [])
.controller('eventsCtrl', function($scope) {
})
.controller('atlantaSummit2016Ctrl', function($scope) {
})
.controller('sanFranciscoSummit2016Ctrl', function($scope) {
})
.controller('dallasSummit2016Ctrl', function($scope) {
})

then becomes:

angular
.module('app.controllers', [])
.controller('eventsCtrl', function($scope, EventsService) {
$scope.events = [];
EventsService.getEvents().then(function(res) {
$scope.events = res;
});
})
.controller('eventCtrl', function($scope, $stateParams, EventsService) {
$scope.event = [];
EventsService.getEventDetails($stateParams.id).then(function(res) {
$scope.event = res;
EventsService.getEventAttendees($stateParams.id).then(function(res) {
$scope.event.attendees = res;
});
});
})

Step 6: Implement Services

First of all, we need to put together a quick API which will provide data manipulation layer for our app.

For the purpose of this demo, I put together a quick Express API running with nodeJS available here.

Given the API is now running at http://localhost:3412/, we have the following endpoints:

  • GET /events
  • GET /events/:id
  • GET /events/:id/attendees

Let’s plug all those in our EventsService:

angular.module('app.services', [])

.service('EventsService', ['$http',
function($http) {
return {
getEvents: function() {
var promise = $http.get('http://localhost:3412/events').then(function (response) {
return response.data;
}, function (response) {
console.log(response);
});
return promise;
},
getEventDetails: function(id) {
var promise = $http.get('http://localhost:3412/events/'+id).then(function (response) {
return response.data;
}, function (response) {
console.log(response);
});
return promise;
},
getEventAttendees: function(id) {
var promise = $http.get('http://localhost:3412/events/'+id+'/attendees').then(function (response) {
return response.data;
}, function (response) {
console.log(response);
});
return promise;
}
}
}
]);

Step 7: Serve!

At this point, we have our app connected to a working API and we are ready to publish!

Display the app in a browser with android and iOS version side by side

$ ionic serve --lab

Build and run the app in iOS simulator

$ ionic build ios && ionic run ios

Build and run the app in android simulator

$ ionic build android && ionic run android

Package your app for store publication via Ionic package

$ ionic package build ios --profile dev

Resources

Ionic Framework – http://ionicframework.com/
Ionic Services – http://ionic.io/
Ionic Creator – http://usecreator.com
Ionic Creator Tutorial Videos on Youtube
Ionic Package – http://blog.ionic.io/build-apps-in-minutes-with-ionic-package/
Find help on Slack – http://ionicworldwide.herokuapp.com/

Software Test Engineering at Axial

At Axial, all of our Software Test Engineers are embedded in the development teams. We come in early on in the development life cycle to do the testing. We firmly believe that quality can be built-in from scratch, therefore, we spend a lot of time educating other members of the team how to think of testing. We encourage developers to test, write unit tests, and pair program. Everybody on the team should be able to test and write automation to support the testing activities. Our developers allocate a certain amount of time to write unit tests and are responsible for them. Both testers and developers have shared ownership over the integration and API tests. Here is where we pair up to build out test suites based on test ideas. We use mind mapping tools, stickies, and brainstorm together to determine what needs to be automated. A good rule of thumb is to focus on automating the repetitive regression tests as well as the scenarios based on recurring bug fixes. Automation offers invaluable support to to us testers, and it allows us to focus on the exploratory and smarter type of testing that lets us catch more corner cases.

Pairing is something that is very important when it comes to testing. Having a fresh set of eyes look at a piece of software helps us broaden our perspective. To not only pair with other testers, but also, with developers, product managers, customer service, sales representatives, and even end-users helps us get better perspective and momentum.

We spend time creating documentation both in a written format, but also, in visual and video format. This allows for the ability to get new people on board quickly and share this knowledge across departments. As testers, we are serving many stakeholders. By keeping documentation up-to-date, we are enlightening the organization about testing, and that generates more interest in testing. One thing we value a lot at Axial is “dogfooding”; to have people from all departments test is valuable to all. It provides us with feedback so that we can develop better software.

Some might say that testing is dead and that everything can be automated, but that could not be further from the truth. Testing is a craft. It is an intelligent activity performed by humans. Computers help us save time and money, by automating what is already known, but having smart testers embedded in development teams brings real value. To communicate well and to ask questions about development, risks, requirements, etc. are two of the most important skills a tester can have, especially in an Agile team. Asking questions to gain knowledge and communicating well will help you to quickly identify risk areas and prevent development issues ahead of time potentially saving the team both time and money. These abilities are something that differentiate an excellent tester from a regular tester whose mindset is set entirely on just finding bugs.

There are many branches of testing to think of. Functional is one, security, performance, UX, location and accessibility testing are some others. Tools can help us do our job better. But it is how we think and act as testers that will make a difference. Keeping a positive, solution-minded attitude and looking at issues in an objective manner helps to eliminate personal constraints in a team. We share the quality interest, and work, together as one to ship a quality product.

Staying connected to the software testing community, going to conferences, meetups such as CAST, TestBash, NYC Testers and Let’s Test, and interacting with great people in the field really helps motivate us, gives us new ideas and brings our craft to a whole new level.

We read a lot, listen, follow (and question) some of the thought leaders in the field. Here are three testing quotes from some of my favorites:

“The job of tests, and the people that develop and run tests, is to prevent defects, not find them” – Mary Poppendieck

“Documentation is the castor oil of programming.” – Gerald M. Weinberg

“Testing is an infinite process of comparing the invisible to the ambiguous in order to avoid the unthinkable happening to the anonymous.” – James Bach


If you are interested in chatting about testing, automation tools and different methodologies, please feel free to reach out to us @axialcorps

In the upcoming blog posts we will do on Software testing, we are going to post hands-on tutorials, videos on how to set up test environments with Protractor and, Gatling, as well as break down how we do pair testing. Stay tuned!

Anatomy of a Mobile App development project

Screen Shot 2015-09-23 at 5.14.22 PM“Being the first to respond to a deal on Axial gives you a 19% greater chance to closing it.” – Peter Lehrman – Bloomberg Business 2015-09-11

It is based on this insight that, for the past 6 months, Axial has assembled a team dedicated to putting together a solution that gives the investors the power to control and direct deal flow within the palm of their hands. Introducing Axial Mobile for iOS!

Native vs Hybrid

Over the past few years, a recurring topic has been whether to develop mobile apps using native languages (Swift/Objective-C for iOS or Android SDK) or hybrid frameworks relying on platforms’ browsers (UIWebView for iOS or WebView in Android).

While the native approach allows for a closer integration with each platform’s abilities and greater hardware responsiveness, the decision to go with the hybrid approach was motivated by several factors:

  • one unique codebase:
    • ease of maintenance,
    • multi platform deployment simplified,
    • simplified testing
  • ability to use a familiar framework:
    • smaller learning curve
    • supporting resources immediately available
    • ease of development scaling if required
  • maturity of the Ionic framework:

The choice of Ionic Framework

Over the last two years, Ionic has grown to become the reference framework in the hybrid community, providing custom industry standard components built on the Angular framework

Relying on Apache Cordova to enable developers to access native device function such as the camera or accelerometer directly from JavaScript, Ionic has created a free and open source library of mobile-optimized HTML, CSS and JS components, gestures and tools for building interactive apps from JavaScripts.

Moreover, the Ionic.io platform comes with a complete hybrid-focused suite of mobile backend services to integrate powerful features such as push notifications and rapid deployment.

Since we have adopted Angular as our reference front-end framework, it is only natural for Axial to leverage many of Ionic components and services in order to deliver the most embedded experience to its members.filter

Push notification integration

Using Ionic.io’s push service, we have the ability to notify members of deals they receive instantly. Our members also have the ability to adjust their notification preferences:settings

We can also very efficiently trigger updates in the background so that it ensures a smooth user experiences by preloading updated data using silent notifications.

Rapid deployment process

The Apple App Store release process takes approximately a week. However, in order to fix critical issues or release changes rapidly, 7 days can seem like an eternity.

For this reason, Ionic.io’s deploy service allows us to release any non binary affecting changes on the go. As a result, having this flexibility allows us to ship code more frequently, enhancing our members experience without forcing them to go through painful, often delayed (or forgotten) updates via the App Store.

Contributions to Ionic

Despite numerous features and wildly embraced standard components, Ionic may have some gaps. As we have discovered during the implementation of Axial Mobile, while the right-to-left swipe gesture on a collection repeat item was available, the opposite left-to-right gesture was not.

Thankfully, building a wildly adopted Angular framework, it was simple enough to implement our own left-to-right swipe gesture and submit a pull request on Github in order to contribute to the framework and give back to the open source project.swipes

Future Developments

Having shipped our Axial Mobile version 1.0 on September 21st, we are now awaiting feedback from users.

Our members now have the ability, in the palm of their hand, accessible from anywhere, to pursue or decline deals and create conversation around the ones that catch their interests.
Soon, we will be integrating HelloSign services to provide a way for our members to sign NDAs and other documentation directly on their smartphones screen, allowing them to engage one step further in the deal making process.

What’s Blocking My Migration?

At Axial, as at many other companies, we have software written in the olden days still in active use. It does what it’s supposed to do, so replacing it is not the highest priority. However, sometimes these older scripts keep database transactions open longer than are necessary, and those transactions can hold locks.

This poses a problem when we’re running Alembic migrations; modifying a table requires a lock not just on that table, but on other tables, depending on the operation. (For example, adding a foreign key requires a lock on the destination table to make sure the foreign key constraint is enforced until the transaction is committed.) Sometimes we developers run a migration and it seems to be taking a long time; usually this is because it’s waiting for a lock. Fortunately, it’s really easy to check on the status of queries and locks in PostgreSQL.

There are three system views we care about: pg_class contains data about tables and table-like constructs, pg_locks contains the locking information (with foreign keys to pg_class), and pg_stat_activity contains information on every connection and what it’s doing. By combining data from these three views (technically pg_class is a system catalog, not a view, but whatever) we can determine which connections are holding locks on which tables, and on which tables a given connection is awaiting locks. We have a script called whats_blocking_my_migration that queries these views.

Rather than explain the columns on these views (which you can see very easily in the docs anyway), I’ll show you the queries we execute.

The first thing we do is get information on Alembic’s connection to the DB. In env.py, we set the “application_name” with the connect_args argument to create_engine; this way we can identify the connection Alembic is using. Once we do that, we can use application_name the check the status of the Alembic connection. If there are no rows, or if none of the connection rows are actually waiting, the script prints that info and exits.

SELECT pid, state, waiting FROM pg_stat_activity WHERE application_name = 'alembic';

However, if an Alembic connection is “waiting”, that means something’s holding a lock that it needs. To find out what, we use the pid (which is the pid of the Postgres process handling the connection) to query pg_locks. Our script actually does a join against pg_class to obtain the table name (and make sure the relation is kind ‘r’, meaning an actual table), but the table name can also be obtained directly from the relation by casting it from oid to regclass.

SELECT relation, mode FROM pg_locks WHERE lock type = 'relation' AND granted IS FALSE and pid IN alembic_pids;

This gets us the list of tables that the Alembic connection needs to lock, but there’s one more step we can take. pg_class will also tell us the pids of the connections that are holding locks on these tables, and we can join that pid back against pg_stat_activity to obtain the address and port number of the TCP connection holding the lock. (Unfortunately, most of our connections don’t yet populate application_name, so we have to provide this info, which the user can cross-reference with lsof -i to figure out which service is holding the lock.) The query looks a bit like this:

SELECT client_addr, client_port FROM pg_stat_activity JOIN pg_locks ON pg_stat_activity.pid = pg_locks.pid WHERE pg_locks.granted IS TRUE AND pg_locks.relation IN locked_relations;

There’s no real secret sauce here; it’s just some basic queries against the Postgres system views, but this makes the lives of our developers a little bit easier.

Reaxial Update – On Stages And Actors

Since I last wrote about Reaxial we’ve come up with some new abstractions that make it easier to write reactive handlers, and have been busy transitioning our code to use the new architecture. I thought I’d take this opportunity to share our progress with you.

As we started transitioning to Reaxial, we realized that creating an entire service for each reactive component was a bit of overkill. Many features we have implemented with reactive components run sporadically and are not particularly time sensitive, and typically there are a number of features that depend on the same updates. Having a separate process and a separate connection to Kafka is wasteful and inefficient in these cases. However, other features have to react in a timely fashion, so for those we do want a dedicated process with its own Kafka connection.

To accommodate these different use cases, we came up with the concept of a “stage” service that can host one or more “actors”. An “actor” is our basic building block for reactive components. Each actor is a python class that derives from this abstract base class:

class Actor(object):
 def topics(self):
 """ Return a list of the topic(s) this actor cares about. """
 raise NotImplemented

def interval(self):
 """ Return the batching interval for this actor. This is the maximum
 interval. If another actor on the same stage has a shorter interval,
 then the batching interval will match that interval.
 """
 return 30

def process(self, topic, messages):
 """ Called periodically for this actor to process messages that have been
 received since the last batching interval. If messages for multiple
 different topics have been received, then this method will be called
 once for each different topic. The messages will be passed as an array
 of tuples (offset, message).
 """
 raise NotImplemented

@property
 def log(self):
 return getLogger(self.__module__)

All that is required for an actor class to override is topics() and process(). The topics() method simply returns a list of Kafka topics that the actor wants to handle, and the process() method is then called periodically by the stage service with a set of messages from one of these topics. The stage service works by collecting a batch of messages (1000 by default) across all the topics that all the actors within that stage care about, and then invoking each actor’s process() method with the messages in the topics that that actor cares about. If the batching interval expires while the stage is collecting messages, then the messages that have already been collected are processed immediately.

Once an actor is defined, it has to be configured to run within a specific stage. We are using a simple INI-style config file using betterconfig to define the various stages. Each stage is a section in the config file and the actors are specified by adding the python dotted path to the actor class to a list inside the section. In addition, the batch size for the stage can be changed here too.

We are still in the middle of the process of converting the functionality in our legacy platform to Reaxial, but we have already defined 30 actors running on 7 different stages. Having the infrastructure to easily decompose a feature into reactive components like actors improves the modularity and reliability of our system, and also improves testability. We can very easily write unit tests that pass specific messages to an actor and by mocking out the methods that the actor calls, we can test arbitrary scenarios without having to set up anything in the database. Plus, because actors only implement one feature, or one piece of a feature, they are straightforward unit testing targets.

One obvious area for improvement is to enhance the stage service so that it dynamically decides which actors to run on which stages by observing their behavior. This has always been in our plans, but because it is a complicated optimization problem and carries significant risks if not implemented properly, we decided to stick with the manual stage configuration for now, coupled with monitoring of the stages to ensure that time-sensitive messages are being handled within the expected time. So far this is working well, and as we improve this system we’ll keep you updated on our progress.

Industry Similarity via Jaccard Index

Screen Shot 2015-05-01 at 11.52.32 AM

At Axial, we have a taxonomy tree for industries and want to know if one particular industry is more similar to another industry. The similarity of some of the industries are straightforward if they share a parent, but this similarity is not quantitative and does not produce a metric
on how similar the two industries are.

In the search page and other parts of the website, it would be useful for us to be able to
compare two different industries whether they belong to the same parent node or not. For example, if user chooses an industry in the on boarding process, we should be to recommend another industry based on the selected industry. This not only makes sure that user would choose consistent industries taxonomies but also exposes the similar industries she may not know. This is something we planned to do, but let’s look at how this feature is put into the production right now.

Industry Ordering In-App Search

In the app-in search page, when user selects a particular industry in the industry facet search,
we want to order the industries of the documents(campaigns, projects and companies)
based on the selected industry. Since we do not limit the number of industries for projects,
the ordering of the industries for the project would become quite handy to compare against
the industry facet.

Similarity in General

For other parts of the website, we could measure the similarity between industries when we want to compare how similar the two documents are in terms of industries they are assigned to or how good the match relationship between campaing and a project. Producing a similarity metric for industries gives a proxy on how similar two documents are.

Industry Similariy via Jaccard Index

In order to do so, we used Jaccard Index to measure similarities between industries based on
campaign keywords that are associated to each industry. Let’s review what a Jaccard Index is and
then I will explain how it is used to measure similarity between two industries.

Jaccard Index

Jaccard Index is a statistic to compare and measure how similar
two different sets to each other. It is a ratio of intersection
of two sets over union of them.
jaccard(A, B) = \frac{A \cap B}{A \cup B}

If you have representative finite number of elements for a particular
observation and you want to compare this observation with another
observation, you could count the number of items that are common to both of
these two sets. It is a natural fit for comparing posts if you know
the representative tags for the posts to measure how similar two articles
are in terms of tags.

Its python implementation is pretty trivial.

def jaccard_index(first_set, second_set):
""" Computes jaccard index of two sets
Arguments:
first_set(set):
second_set(set):
Returns:
index(float): Jaccard index between two sets; it is between 0.0 and 1.0
"""
# If both sets are empty, jaccard index is defined to be 1
index = 1.0
if first_set or second_set:
index = float(len(first_set.intersection(second_set))) / len(first_set.union(second_set))
return index

first_set = set(range(10))
second_set = set(range(5, 20))
index = jaccard_index(first_set, second_set)
print(index) # 0.25 as 5/20

Industry Similarity

I talked about a little bit on our industry taxonomy earlier not only we wanted to expose in different ways but also we want to measure how similar they are to each other. The problem is that we did not have a good way to compare two different industries. Since our taxonomy structure is a tree, we could group them by their parent nodes but not necessarily compare and measure how similar they are in a robust and reliable way.

Instead of coming up a heuristic based approach to measure similarity, we decided to use the user data.
We have keywords for campaigns that our members created. When members create a Campaign, they could enter a set of keywords along with industries that they chose. We decided to use this information to compare and measure a similarity between industries using campaign keywords.

The idea is simple; if two industries have a lot of common keywords given a campaign a profile, then the chances are they are closely related. As our members choose similar keywords for those industries to represent their campaigns, the likelihood of similarity only increases.
By using campaign keywords, we not only reduce the dimensionality of the text(generally the descriptions are much longer than campaign keywords) but also, we do already a feature selection as the campaign keywords should be much more descriptive, dense and rich in information than the descriptions.

Industry Similarity by Jaccard Index

In order to build an industry similarity measure, we first assigned the campaign keywords to each
industries. Then, for a given industry, we could compute the jaccard index in a very straightforward manner. But what if we want to compare multiple industries against all of the industries that we have in the database? We could still could use the jaccard index for multiple industry comparison even if it is not formally defined for multiple sets.

However, one can generalize Jaccard index which is very easy to do since what we do is only intersection and union operations across different sets, we could do this among multiple industries in our exmapleas in the following:

jaccard(A_1, \ldots, A_n) = \frac{A_1 \cap A_2, \ldots, A_{n_1} \cap A_n}{A_1 \cup A_2, \ldots, A_{n-1} \cup A_n}

This is pretty neat. Note that set order does not matter(icing on the cake).

What was available?

When we already have the intent of the user(industry facet), it is relatively easy to put that industry in the first place and the remainder industries would follow the first industry.

When user chooses Aerospace & Defense before industry ordering, we were displaying the industries of the documents in no particular order:

aerospace-defense-industry-ordering


With industry ordering, we now sort the industries by similarity:

aerospace-defense-after


Before “wine” search in Distillers & Vintners:

distillers-vintners-before-industry-ordering


After industry ordering is in place:

distillers-vintners-after


As mentioned before, this ordering is easy to extend to multiple industries as well:

two-industry-selection


Tom Cruise’s Bacon Number

Tom Cruise’s Linguistic Bacon number is 2
Tom Cruise and Kevin Bacon are connected by strip search.
  1. cruise and strip search are related by the word search
  2. strip search and bacon are related by the phrase bacon strip

The phrase strip search is what linguistically connects the words cruise and bacon.

What are Bacon Numbers?

Google has been computing Bacon Numbers since 2012.  If you search Google like this “tom cruise bacon number” you should see the following:

Screen Shot 2015-03-20 at 11.54.32 AM

How does this relate to Axial?

Spoiler alert… it doesn’t directly.

At Axial we are innovators defining the authoritative network for the entrepreneurial economy. The engineering and product teams work together finding new and interesting ways to wire our network. And as an engineer working on our Search and Recommendations engines I study our social graph and help to create new connections to bring buyers and sellers together to close more capital deals.

It relates to Axial in that the bacon number calculation requires creating a new network and exploring innovative relationships.

And hopefully I got your attention by juxtaposing Tom Cruise with the TSA and Kevin Bacon.

Calculating Linguistic Numbers

Computing Shortest Paths

I loaded WordNet’s database into networkx (a lightweight python network library) which supports shortest path calculations of a graph. Tom Cruise’s linguistic bacon number is simply a shortest path calculation between the word nodes “cruise” and “bacon” (code can be found here):

Shortest Path Explained:
1. cruise        hypernym     look for a sexual partner in a public place
2. search        homophone    search or seek
3. strip search  collocate    searching someone for concealed weapons or illegal drugs
4. bacon strip   collocate    a slice of bacon
5. bacon         homophone    cured meat from the sides and belly of a pig

About WordNet

WordNet is organized like a thesaurus, in that words are grouped together by meaning. The WordNet documentation refers to these unordered groupings as synsets which are linked together by semantic relationships. For example, since cruise is a type of search the database labels this relationship as a hypernym (which is a word with a broader meaning, the opposite or more narrow meaning is referred to as a hyponym).

There are a number of projects built on top of  WordNet. Below is a visual dictionary called WordVis that I like and use occasionally:

Screen Shot 2015-03-11 at 4.51.02 PM

Adding Collocates and Homophones

I made some modifications to the WordNet database to create additional words and lexical relationships that I thought would allow for more interesting word-play.

A collocate is a word commonly used with another word (or words). For example, dune collocates with buggy and is placed into a synset with the following semantic meaning: “a recreational vehicle with large tires used on beaches or sand dunes“. I tokenized collocates into unigrams and added a new lexical relationship between the words. This new relationship shortened the path between cruise and bacon because of the new edge I created between strip and search.

Since WordNet is organized by synsets, there is no need for a relationship between identical words that appear in different synsets. For example the word punch exists in a synset for a drink and one for a blow with a fist, but the synsets have no semantical relationship. I added these as edges and labelled them as homophones. I explored adding homophones by spelling (e.g. knew and new) and found a lot of support from Carnegie Mellon like this phonetic dictionary and this homophones list which contains “gnu,knew,new“.

Game Play and Network Analysis

I originally did this hack to explore game ideas around word-play. Many ideas were related to finding paths between unrelated words by displaying how the shortest path changes when users insert their own words with the goal of completing the path.  I haven’t figured out a gamification element that would be engaging, please comment if you have any ideas.

I do enjoy looking at solutions to random paths.  I frequently see connections to words that are not obvious at first because I am not thinking about the specific meaning that resulted in the edge in the graph.  For example, cruise makes me think only about meanings that relate to words like travel, journey, and navigate, but the gerund cruising connotes something entirely different and leads to words like search.  I think this is what is fun and didactic.

And this is what is fun about working on Axial’s Network, i.e. finding new relationships through subtle changes in the mining, analysis, and exploration of the capital market graph.

GitHub Repo

bacon-bits

Topic Modeling for Keyword-Phrase Extraction

blei_lda_illustration

We were frustrated about visibility of our taxonomy for industries to the user. If one of our member wanted to do a search in Axial for a particular field, they needed to know the exact taxonomy name that we use for that field. For example, if one wants to search wood and wood products, they need to know that those would fall in our “Forest Products” taxonomy, which is not an obvious thing when a user wants to do a search in our website.

Not only this limits the query capabilities of the user but also it degrades our search results as we do not know which industry they are interested in.

In order to tackle this problem and get the following benefits(listed below), we use topic modeling for a number of documents to extract topics and mine phrases to provide a better typeahead functionality to the user.

  • How do you extract phrases and keywords from a large number of documents?
  • How do you find recurring themes and topics from a corpus without using any metadata information(labels, annotation)?
  • How do you cluster a number of documents efficiently and make sure that clusters would be coherent themes?

Topic modeling is a method which is an unsupervised learning and clustering method which enables us to do things listed above.

If you want to deconstruct a document based on various themes it has, as shown above in the image, it is a great tool to explore topics and themes. In the image, every color corresponds to a particular theme and all of the themes have various words. But what does a topic look like?

Topics as Word Distributions

When you see the following words, what do you think:

wood pellet pellets energy biomass production tons renewable plant million fuel forest management heating development carbon facilities

if you think forest, wood or paper, you would be right. These are the subset of words that are extracted from Forest Products industry in opportunities that our members created.

Industry Aliasing

Previously, if our members wanted to search a particular industry, they needed to know the exact name of the industry in order to see the typeahead match in the search bar. We do matching by Named Entity Recognition in Query (NERQ) but it is limited to the exact keyword match in industries.

For example, if they want to do a search related to the “wine” industry, they need to know our taxonomy which corresponds to that industry which is “Distillers and Vintners”. Or, if they want to do a general search related to “shoes”, they need to know that we have a “Footwear” industry.

In order to remedy this problem, we expanded our industry matching to a larger number of words so that we could match “related” and “relevant” keywords to our taxonomies. When a user types in “wine”, we are able to match that keyword to our related taxonomy of “Distillers and Vintners”.

Topic Modeling for Keyword Extraction

We used topic modeling for keyword and phrase extraction using user generated documents that are classified by industry. This provides three main benefits. First, all of the keywords are data-driven and human generated. Second, since every document is associated with various industries, we do not need to associate the documents one by one to each topic, we could mine the keywords and phrases per industry. Last but not least, we could use the industry information as input to our topic sensitive ranking algorithm to improve on search precision.

We created a set of keywords/phrases (around 4000) to expand the matching between what a user types and which industry it will match. Since most of the keywords and phrases are descriptive of the industry itself, they would be intuitive to a user.

Topic Model

The grouping of relevant words is highly suggestive of an abstract theme which is called a topic. Based on the assumption that words that are in the same topic are more likely to occur together, it is possible to attribute phrases or keywords to a particular topic. This allows us to alias a particular topic with a number of phrases and words.

Not all words are created equal

As we are more interested in the more thematic and somehow specific topics, we are not necessarily interested in words that do not contribute a lot to various topics. Usual suspects are the articles (a, an, the) pronouns (I, you, she, he, we, …), prepositions(in, under, of, ..) and also common adverbs and more often than not verbs.

Oh, also the adjectives:

When you catch an adjective, kill it. No, I don’t mean utterly, but kill most of them–then the rest will be valuable. They weaken when they are close together. They give strength when they are far apart. — Mark Twain

Not only they do not contribute to the topics/themes at all, but also they disrupt the word distributions in each topic. Due to these reasons, common words should be removed prior to topic modeling. This is the first rule of thumb. We also removed rare word occurrences, smaller than 3 in the corpus, with the understanding that rare words do not materially contribute to topic distinction. This provides two additional benefits; first we do not have to deal with a large corpus as word distributions in corpora usually have long tails, second we do not unnecessarily do computations on the words classified as unimportant.

Unsupervised Nature of Topic Models

The topic models are unsupervised, i.e. they do not require any prior information on the documents of the corpus, e.g. descriptive labels or other classifications. It infers various topics and themes operating purely on the documents. It is a very powerful and useful tool for quickly exploring various themes in a large corpus. For example, if you are searching for a number of documents that are about one particular theme, e.g. “internet of things”, you want to get the documents that are about that theme (by increasing the recall) rather than documents including the exact phrase of “internet of things”.

Industry Aliasing

By doing so, we created a set of keywords/phrases(around 4000), compare with our industries(around ~200) to map and when you type “wine” in the search bar, you would get “Distillers and Vintners” industry.(yeah, it is hard to guess)

Screen Shot 2015-02-19 at 6.14.03 PM

Or, when you type “search engine” in search(so meta):

search-engine


data-science

Some more:

type-ahead-version-1
Adjectives are not so bad

Remember the adjectives, how useless they are for topic modeling. They could come handy in the conversations:

A man’s character may be learned from the adjectives which he habitually uses in conversation. — Mark Twain

Similarity in the Wild

opportunity_topic_rank_matrix

Opportunity Topic Rank Matrix

Larger Image

Finding similarity across observations is one of the most common tasks/projects which a data scientist does. Collaborative Filtering purely depends on finding similar items(videos for Netflix, products for Amazon) for users. If you are doing a classification task with KNN(K Nearest Neighbor), you are classifying the new observations purely on the distance that you have in the training set. Most of the instance based learning algorithms in one way or another is built on the similarity distances of observations. Clustering algorithms (k-means, manifold learning) depends on the distance between observations.

Similarity

Merriam Webster defines similarity as following:

a quality that makes one person or thing like another

So we want to find items that are similar to each other. But we need to first answer what an item is (Document representation) and how we will measure an item with other items(Distance Metric).

In order to measure the similarity between two observations, all of the observations should be defined in the same way(using a feature extraction method) to build a feature vector and a distance function which measures the distance between these feature vectors.

Document Representation or Feature Extraction

We have three different types in our observations(documents); tp, opp and companies. ‘tp’ stands for transaction profiles, ‘opp’ stands for opportunity profiles and ‘company’ stands for company(surprise!).

We are using a modified version of Topic-Sensitive Page-Rank to represent our documents regardless of their types. Not considering the types of the documents allow us to have same representation vectors that we could compare the documents regardless of their types.

Recently, we introduced Company Introduction feature for the tp owners to recommend companies that are registered to Axial. In order to do so, we need to find “similar companies” that are close to a given tp id. We have also boolean filters that we could use(we are filtering based on company type and industries in future), but after filtering, it pretty much depends on how similar a tp and a company.

Distance Metric

If feature extraction is an important step in any part of machine learning, the distance metric would be the second one. You could have the best feature vectors in the world, but if the distance metric you choose does not make a lot of sense for your feature set or the dimensions in the feature vectors, then the similarity would not make much sense.

For probability distributions, there are many ways to measure the distance(or similarity); l_p distances (l_1, l_2, Chebyshev), cosine, correlation, span-norm, Bhattacharyya, Hellinger and Jensen Shannon Divergence. Based on some experimentation, we decided to use Jensen Shannon Divergence(JSD) to measure the distance between documents.

Let’s talk about a little what JSD actually is.

Kullback-Leibler Divergence

Jensen Shannon Divergence is nothing but an average of two KL Divergence of two probability distributions with an average of the probability distributions. Its formula is in the following: KL(X || Y) = \displaystyle\sum_i X(i) ln \frac{X(i)}{Y(i)}
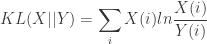
. This is a nice way to measure the difference between a probability distribution comparing to Y which is a reference distribution. One way to reason about this distance metric is to assume two probability distributions are exactly the same. Then, ln \frac{X(i)}{Y(i)} would be zero. They are exactly same, so the distance is 0. Why ln, you may ask and that is related to information theory. KL Divergence is also called relative entropy, so one could think the KL divergence as how much information is gained from X assuming that Y is known. If they are same, information gain is zero.

Jensen-Shannon Divergence

KL Divergence is very nice in terms of what it measures, but it is not a metric that we could depend on. Why is that? It is hidden inside its asymmetric nature. KL(X || Y) \neq KL(Y || X) 
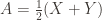
and that is a big problem as we cannot create a proper measure of between two observations without considering which is the reference and which one is the one that we measure the distance between the reference vector. In order to prevent this issue, there is a Symmetrised version(well sort of) which just sums up two different KL divergence between each other(KL(X || Y) + KL(Y || X) in order to reach a symmetrised version of KL Divergence, but we have another way to measure the distance as well, which is most probably obvious at this point.

Instead of looking at the distance between probability distributions to each other, what if we measure an average of them with every single of the probability distribution in order to have a symmetric distance metric.

JSD(X || Y) = \frac{1}{2} KL(X || A) + \frac{1}{2} KL(Q || A)
where A:
A = \frac{1}{2} (X+Y)
and it does not matter the order anymore:
JSD(X || Y) = JSD(Y || X)

Implementation

For a single TP, we first filter out the ones that do not obey the “criteria”(boolean filtering) and then compute the JSD Divergence of a TP for the target documents. The companies that are closest to the TP are our candidates that we should introduce them to the TP owner.

We are using Xapian as our search engine; this is relatively straightforward to implement as an External Posting Source and if your colleague has already implemented it and what you need to do is just refactor and take all the credits writing a blog post of it.

I get that going for me